The Shumagin Current — Sand Point, Alaska · Area M Fisheries · Local & Regional News · Est. 2026

The Shumagin Current

Marine Weather

Shumagin Islands

Shumagin Islands marine forecast (NWS zone PKZ752) with current conditions from Sand Point Airport (PASD). Refreshed daily from marine.weather.gov.

NESW
Wind
mph
From
Air Temp
Visibility
Conditions
Live Wind Gusts · Popof Head · Windy.com
Open in Windy →

ECMWF gust forecast model · gust isolines show numeric mph values across the map. Drag the timeline at the bottom to scan the next several days. Cardinal direction names are listed in the table below.

NWS Marine Forecast · PKZ155 · Daily Snapshot
forecast.weather.gov →

NWS bulletin unavailable right now — read it on weather.gov.

Pulled from forecast.weather.gov · refreshed once daily ·

7-Day Forecast · Sand Point Airport (PASD)
NWS Anchorage

Forecast feed unavailable right now. Open the NWS source link below for the latest verified 7-day forecast.

Tide Table — Sand Point · Today + Next 7 Days · with Sunrise / Sunset
Tide table unavailable right now. Open the NOAA source link below for the latest verified tide predictions.

Source: tidetime.org — Sand Point, AK · Sunrise / sunset via sunrise-sunset.org · View on tidetime.org →

Status: Source last checked moments agoSource: NOAA / NWS Anchorage · tidetime.org Tides · Station PASDLast checked:
Openings & Closures

Area M Fishing Schedule

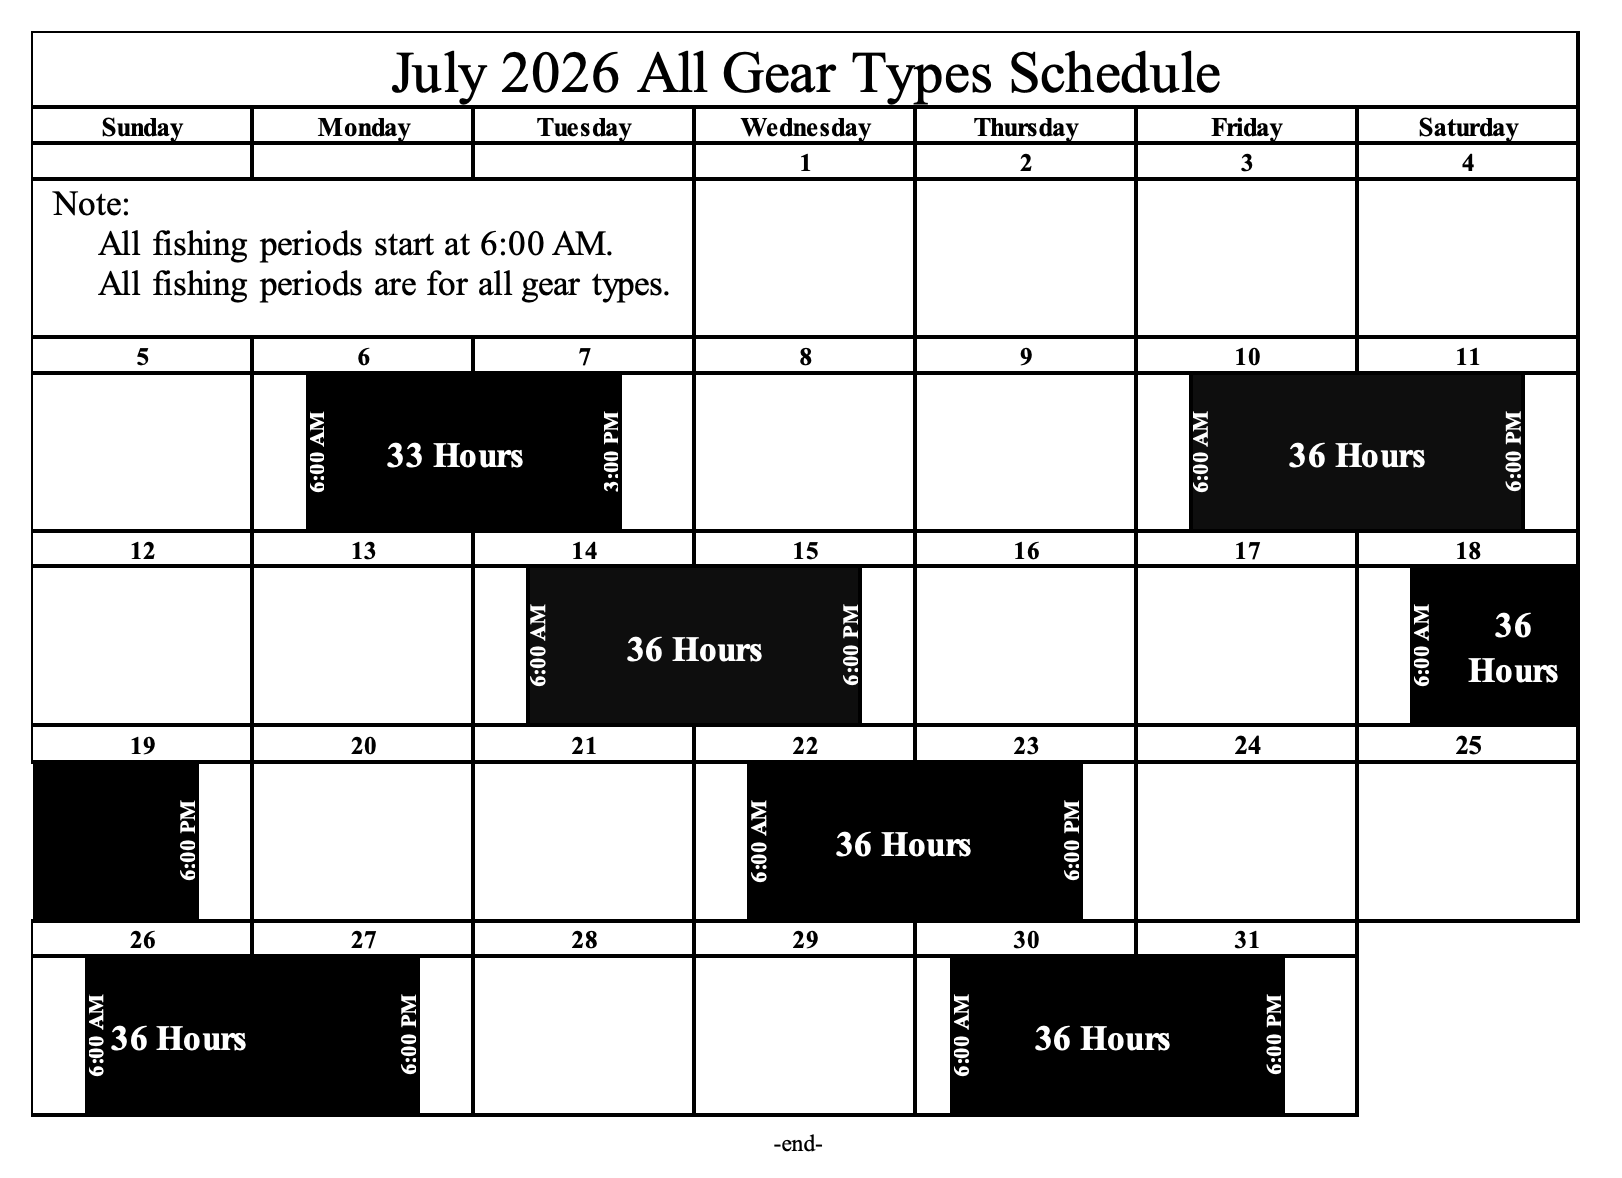
Official ADF&G Area M schedule — all fishing periods start at 6:00 AM and apply to all gear types.

July 2026 Area M All Gear Types Fishing Schedule calendar
July 2026 · All Gear Types · Area M · openings shown in black blocks with start/end times.View Official ADF&G Schedule →
Status: Source linked · July 2026 scheduleSource: ADF&G Area M / Alaska Peninsula Commercial Salmon announcements
Final June Numbers

Alaska Peninsula Commercial Salmon Harvest — June Final

Season-final June totals from the ADF&G Area M harvest summary (last daily report: June 27, 2026). These are the closing numbers for the June Area M chum-conservation period.

Alaska Peninsula Management Area
Commercial Salmon Harvest Summary
(Inseason Harvest Estimates)
Most recent verified figure
Final June total · season closed
Species NameDailyCumulative
Chinook
Sockeye
Coho
Pink
Chum
VerifiedSource: ADF&G — Alaska Peninsula Commercial Harvest SummaryReport: Most recent verified figure
← Front Page·Cover Story · Volume I

Area M’s Strong June Came With Real Chum Restraint

The Area M fleet delivered nearly 3.92 million salmon through June 30 while giving up fishing time, avoiding chum-heavy sets, and staying below the June management pace that would have cut opportunity.
By Colten Mack·The Shumagin Current · Sand Point, Alaska·Preliminary inseason estimates through June 30, 2026 · figures may change
Opinion & Editorial
Personal views of the author. Separate from straight reporting and official data.
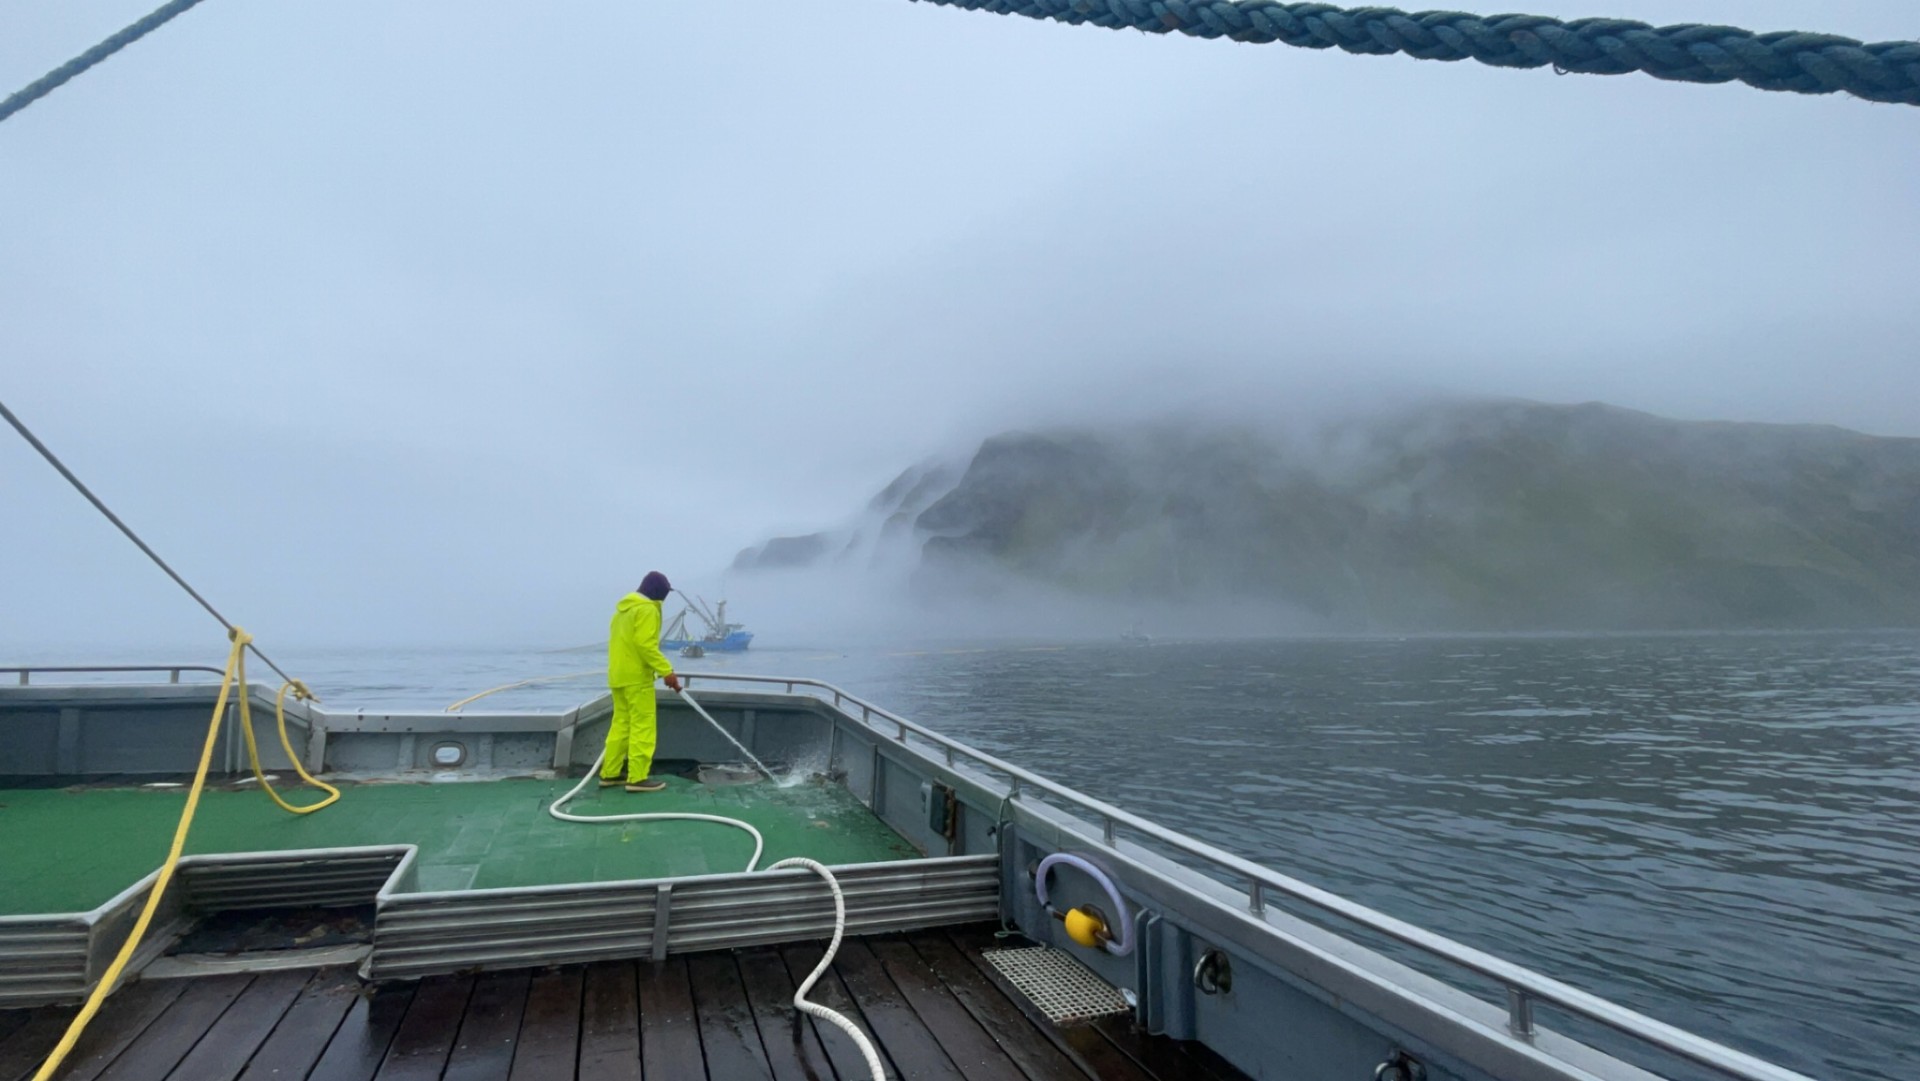
Crew spraying off the deck while holding open on a foggy day in Area M
Spraying off the deck while holding open on a foggy day in Area M.

Area M had a strong June.

Through June 30, the fleet had harvested an estimated 3.92 million salmon — more than 2.12 million sockeye, over 1.31 million pinks, and roughly 480,000 chum, with smaller catches of Chinook and coho.

Put next to the last several years, this June stands out. Most of the recent decade our June sockeye harvests have landed somewhere in the 1.2 to 1.8 million range, and pinks usually did not show in real numbers until well into July. Clearing 2.1 million sockeye and already having more than 1.3 million pinks on the boards by June 30 is not what a normal June looks like out here. It is up near the top of what this fishery has produced in the modern record, and it came in a year a lot of us were bracing for another slow start.

It matters even more because of what a June like this actually does. Crew shares start to build. Processors run. Tenders haul. Fuel docks sell fuel, groceries move off shelves, repairs get made, freight gets paid, and money circulates through Sand Point, King Cove, False Pass, and the rest of the Aleutians East region.
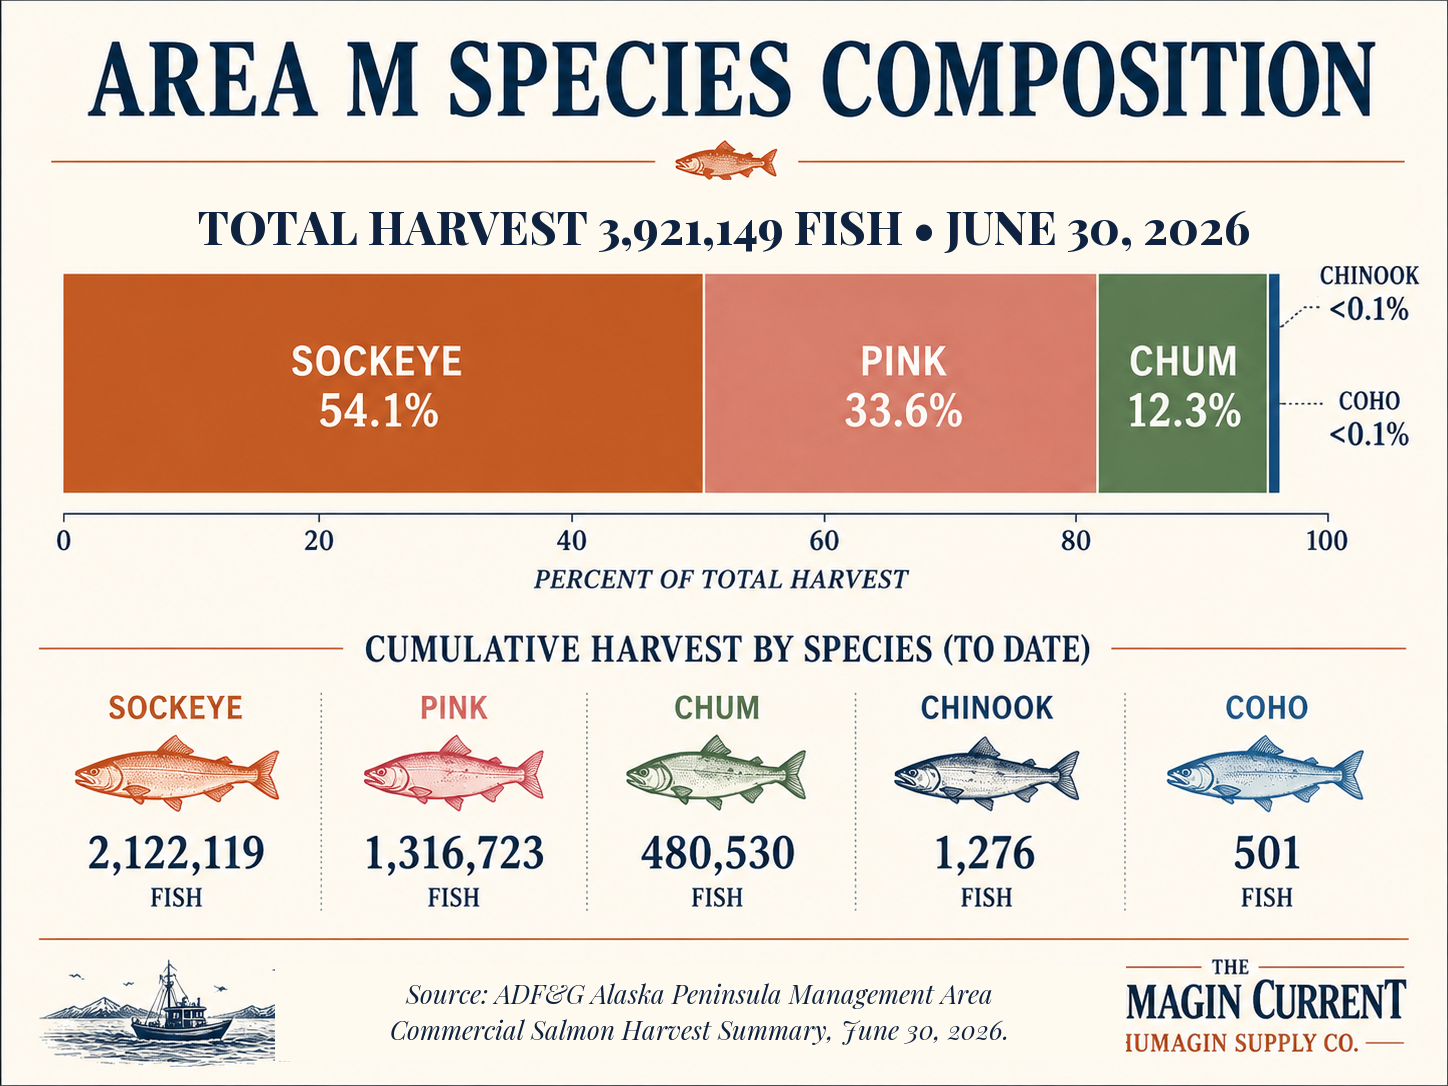
Area M species composition through June 30, 2026
Area M species composition through June 30, 2026 — ADF&G Alaska Peninsula Management Area.

Using the preliminary harvest mix, typical delivered weights, and Trident Seafoods current Area M price, The Shumagin Current estimates June’s Area M salmon harvest generated roughly $10.6 million in direct dockside value.

That is only the first layer of the fishery’s economic footprint.

Once crew earnings, processor payroll, tender work, fuel, marine repairs, groceries, freight, gear, travel, local business spending, and family purchases are included, June likely supported approximately $19 million to $25 million in regional economic activity. That is a working regional estimate, not a formal economic-impact study, but it reflects the reality that fish money does not stop when a delivery is made.

It reaches almost every part of life in this region.

A round trip from Sand Point to Anchorage can run around $1,400 before a family pays for a hotel, food, transportation, or the appointment that required the trip in the first place. Fishing income helps cover medical travel, winter freight, groceries, rent, boat repairs, school clothes, fuel, bills, and the everyday cost of staying in a remote Alaska community.

The fishery also strengthens the local public revenue base. At the Aleutians East Borough’s 2% raw-fish-tax rate, the June value estimate represents roughly $212,000 in potential raw-fish-tax value, assuming the modeled sales are taxable within Borough boundaries and subject to final filings.

That tax is not a one-for-one payment from a fish ticket into a classroom. But it supports the same broader Borough revenue base behind schools, student travel, scholarships, facilities, infrastructure, and the public services that make it possible for families to keep living here.

That is why the Area M story should never be reduced to a harvest chart.

A productive season supports deckhands trying to get ahead before winter. It supports fishermen making repairs, families paying bills, local businesses staying open, and students whose opportunities often depend on travel funding and a community strong enough to support them.

And June’s success came with real chum restraint.

The June chum management plan used 300,000- and 450,000-chum trigger points that reflected an approximate pace of 150,000 chum per scheduled opener. Those were not month-end caps. They were inseason checkpoints designed to determine whether later fishing opportunity needed to be reduced or closed.

The fleet stayed below those trigger levels throughout the month.
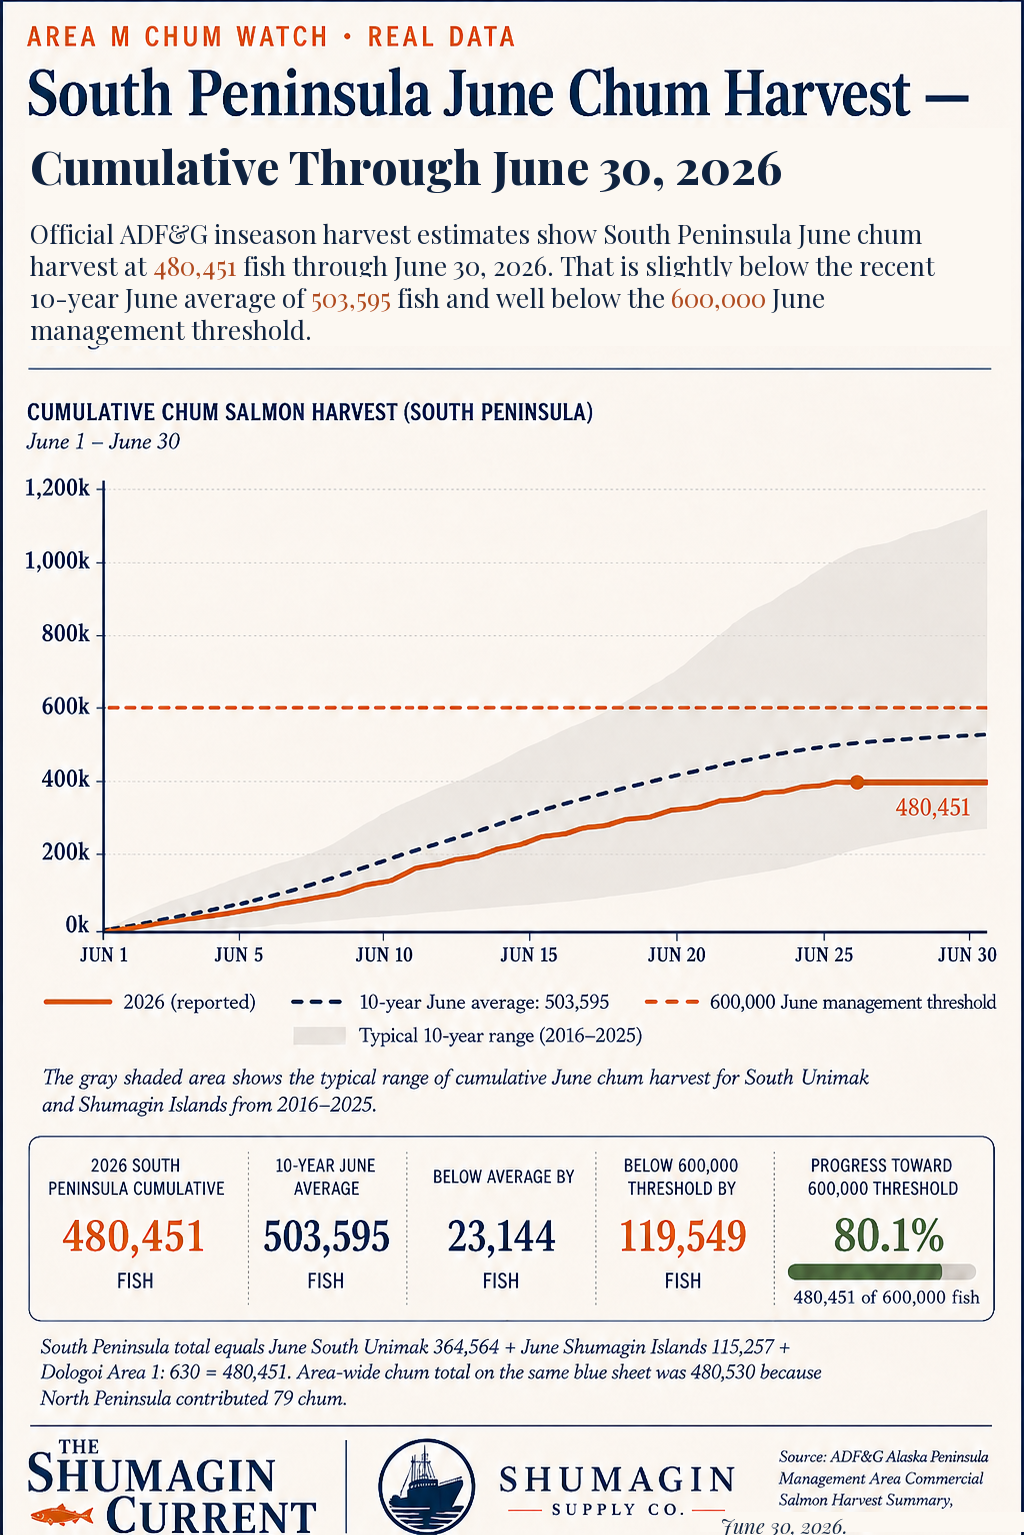
Area M cumulative June chum harvest vs 10-year range
Area M June chum harvest tracked below the 10-year average and well under the 600,000 management threshold.

That did not happen by accident.

Throughout the month, captains communicated constantly about catch ratios and areas where chum numbers were getting too high. Boats either stopped fishing on bad chum ratios or set elsewhere. Captains avoided known hot spots. Fishermen chose not to chase every available fish simply because the schedule allowed them to fish.

Those decisions came with a cost.

Across June, the fleet gave up tens of hours of possible fishing time because chum ratios were not where they needed to be. Near the end of the month, boats effectively gave up most of the final day and a half of available opportunity rather than continue pushing through catches with too much chum.

Those were not imaginary sacrifices.

Every hour left unfished could have meant more sockeye and pink salmon delivered, more crew-share income, more processor hours, more tender work, more fuel sold, more groceries bought, more repair work, and more money moving through the communities that depend on the fishery.

The fleet left that opportunity in the water.

That deserves to be counted alongside the harvest total.

Area M is often discussed as if captains are simply trying to fish every open hour regardless of what is coming over the rail. That is not what happened in June. The fleet had a productive month because fishermen adapted to the water in front of them. They compared reports, watched ratios, shared information, and adjusted when the chum mix changed.

That is what practical conservation looks like.

It is not perfect, and it does not mean the concerns surrounding Western Alaska chum disappear. But it is real-time management built around actual fish, actual timing, and actual conditions on the grounds.

The next checkpoint

For Area M, the next major checkpoint is the July immature-salmon test fishery in the Shumagin Islands.

Before broader July opportunity gets underway, standardized test sets around Popof Head, The Middle, and Red Bluff will help show what is moving through the area. The standard is fewer than 100 immature salmon per standardized set, including immature Chinook, sockeye, coho, and chum observed in the seine web.

That test is not a formality. It is the next real measure of whether July fishing opportunity can move forward cleanly.

The early pink showing is another positive sign.

More than 1.31 million pink salmon had already been harvested through June 27. That does not guarantee the full post-June forecast will come true. Pink returns can change quickly, and July and August still have to produce. But early pink abundance is not unrelated to the outlook ahead. Seeing fish arrive early and in workable numbers is a better sign than waiting for them to show up.

July will tell the fuller story through catch rates, local distribution, escapement, weather, and the continued development of Chignik and regional runs.

But Area M should enter the month with confidence.

June showed that the fishery can create serious value for the region without abandoning conservation. It showed that fishermen will give up time and money when chum ratios demand it. And it showed that captains working together on the grounds can make decisions faster than any outside observer looking at the fishery from far away.

Area M had a successful & responsible June.
Regional Signals

Encouraging Early Reads Around the Region

Nothing here declares a recovery. But relatively stronger early signals in Bristol Bay, Chignik, and on the Yukon are a good sign for the management plans working across the region — and worth watching as July develops.
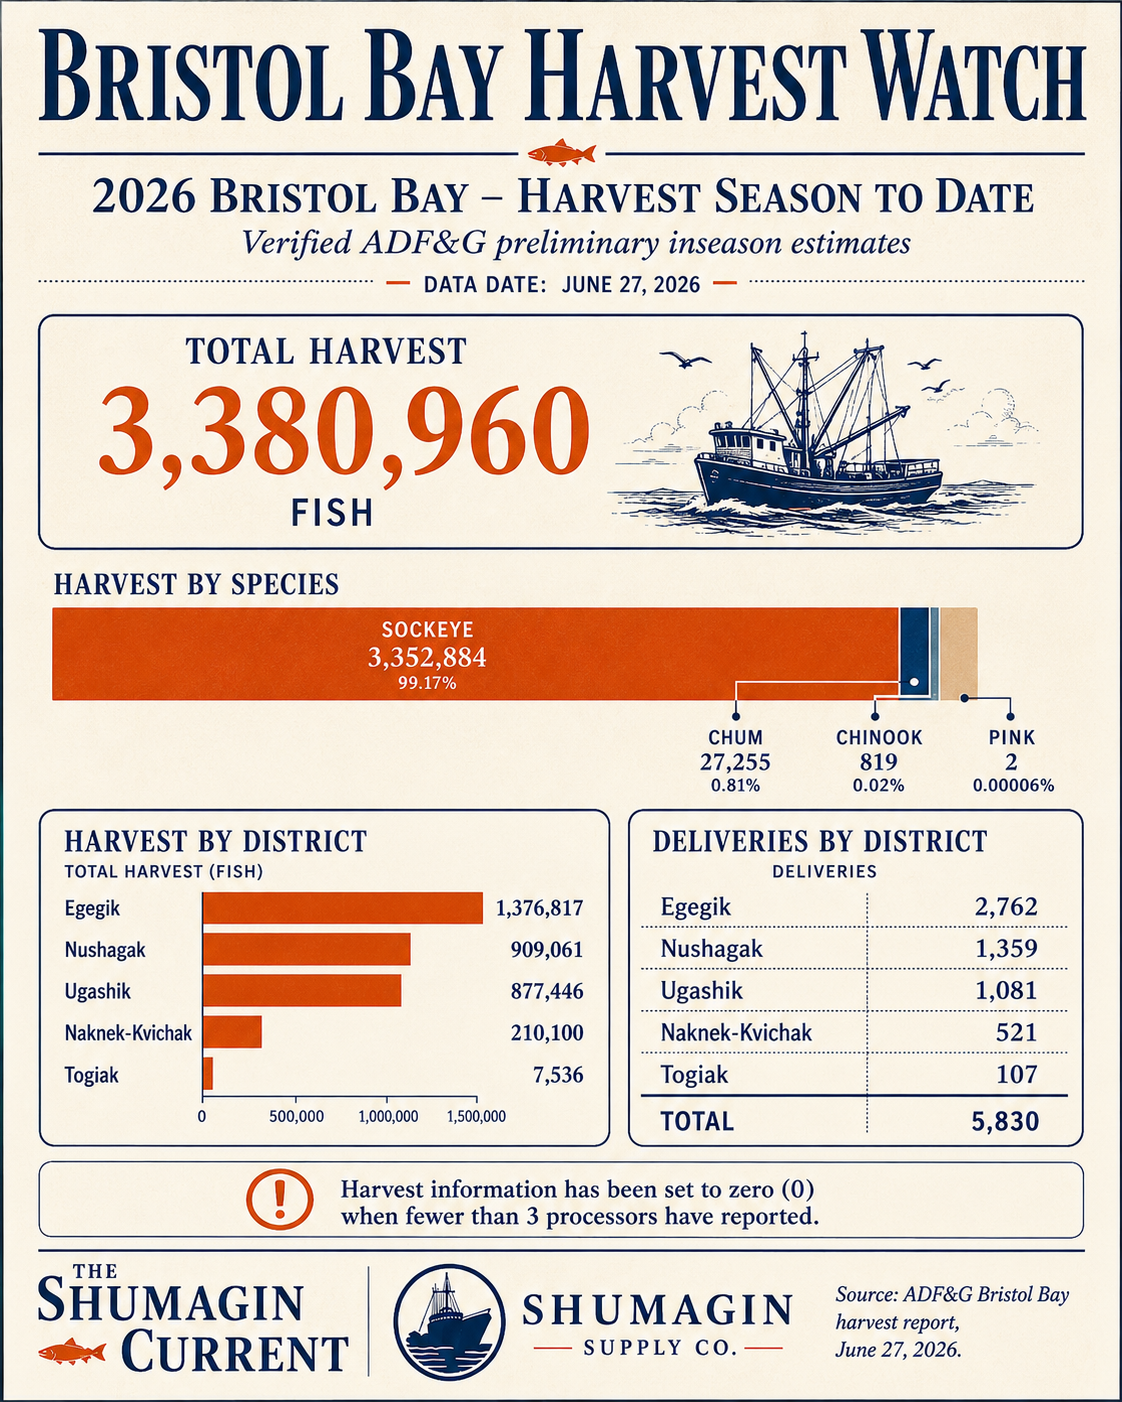
Bristol Bay 2026 harvest through late June
Bristol Bay harvest watch — 3.38M fish, 99% sockeye.

Bristol Bay sockeye came out of the gate strong, with early harvest running well ahead of a typical late-June pace. The run is the clearest early sign that Western Alaska sockeye management is tracking the way it is supposed to.
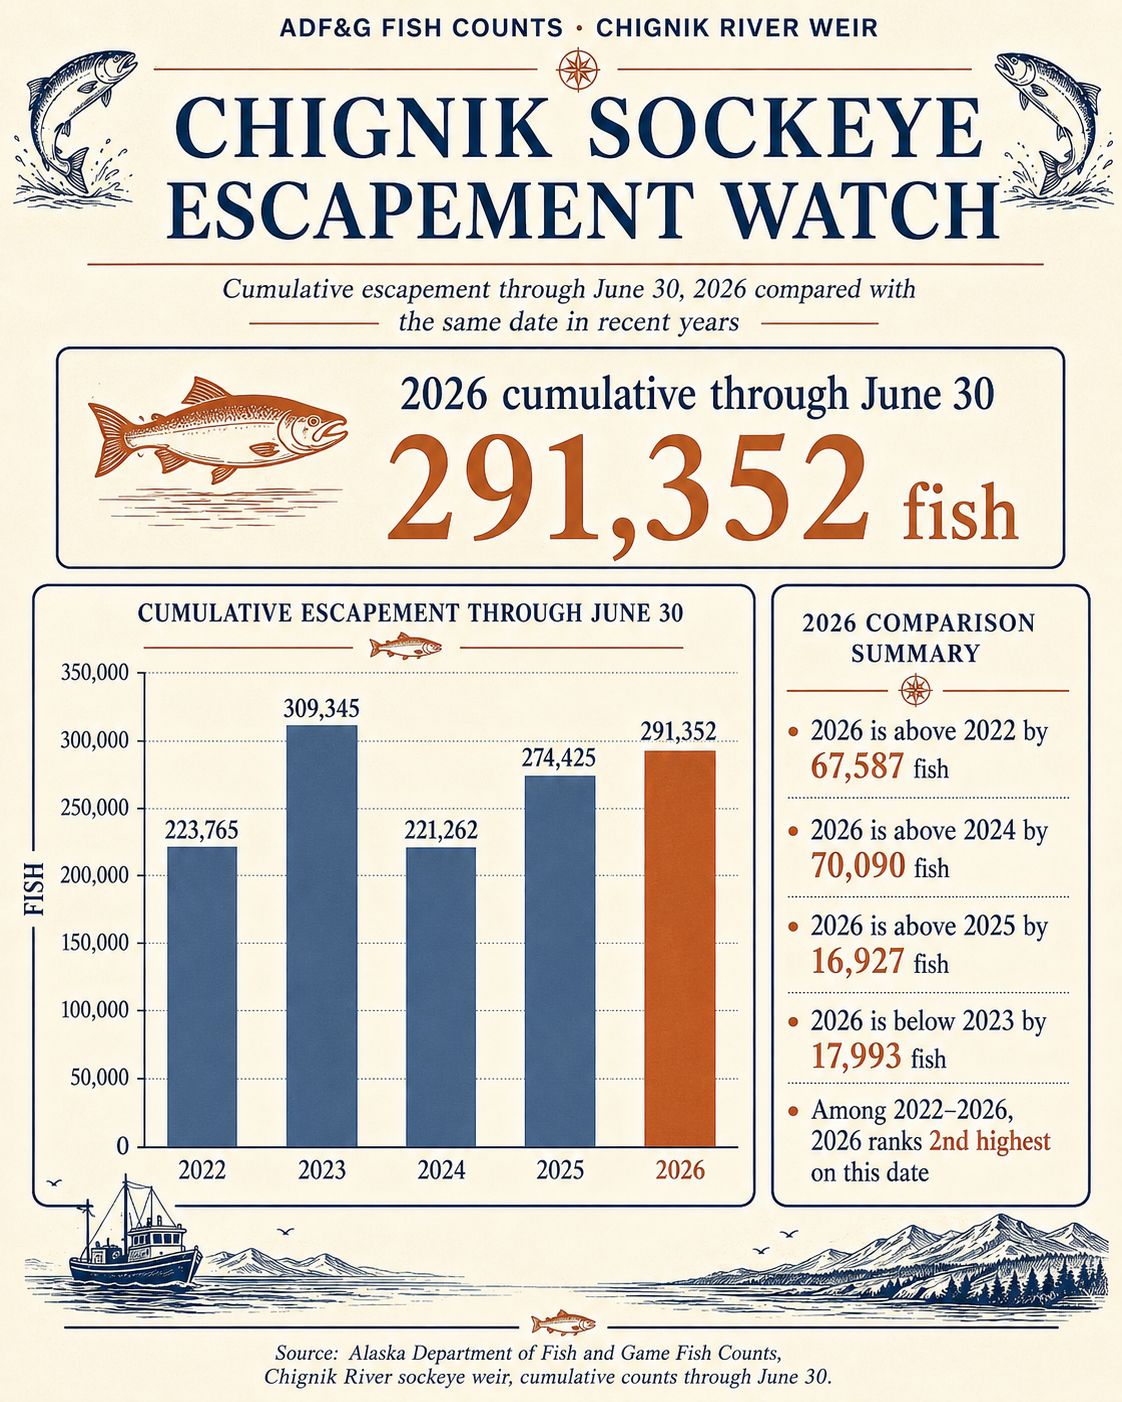
Chignik sockeye escapement through June 30, 2026
Chignik sockeye escapement — 2nd highest through June 30 among the last five years.

Chignik sockeye escapement is running second-highest in five years through June 30. After several difficult seasons for that system, a stronger early return is exactly the kind of indicator managers and fishermen have been waiting for.
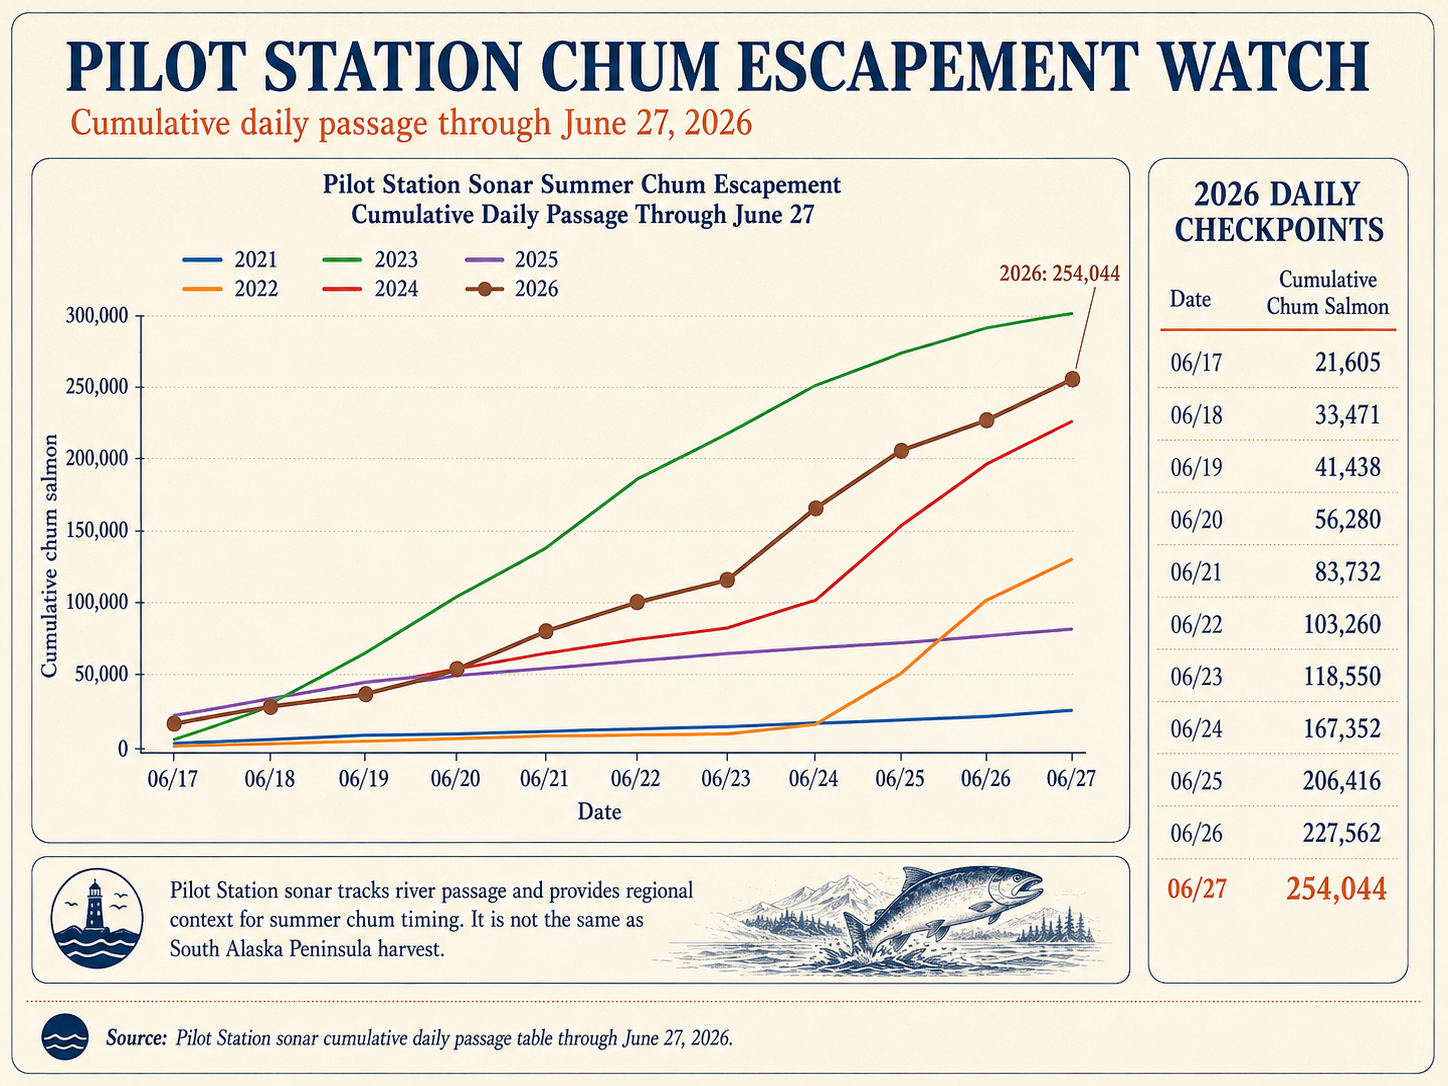
Pilot Station chum escapement cumulative through late June, 2026
Pilot Station chum passage — 2026 running ahead of 2021, 2022, 2024, and 2025 at this date.

Pilot Station chum passage on the Yukon is running ahead of 2021, 2022, 2024, and 2025 at the same point in the season. That does not erase the last several difficult years on the river, and it does not by itself confirm a recovery. But it is a better early read than the region has seen in a while, and a positive indicator that the coastwide chum management approach is heading in the right direction.

Research Library

Science Watch

Research shaping what we know about Area M, the Shumagins, Chignik, the Alaska Peninsula, and the waters our fisheries depend on. Coverage spans local watershed science, salmon ocean ecology, mixed-stock genetics, halibut, Pacific cod, pollock, climate conditions, and the scientific tools used to manage Area M fisheries.

Featured Research — Homepage Preview
A note on sourcing: Not every source below is peer-reviewed science. ADF&G operational plans, genetics reports, management reports, and monitoring projects are labeled as technical or agency research. We distinguish between local evidence, regional evidence, and North Pacific-wide evidence — and we try to explain uncertainty honestly.
No. 4Area M Management Science

South Alaska Peninsula chum genetics: modern stock-composition research

Genetic Stock Composition of Chum Salmon Harvested in Commercial Salmon Fisheries of the South Alaska Peninsula, 2022–2024

Research typeADF&G fishery data series report
SpeciesChum salmon
Study areaSouth Alaska Peninsula commercial fisheries, southern Area M
Publication year2025

This report covers three years of genetic sampling designed to estimate the stock composition of chum salmon harvested in South Alaska Peninsula commercial fisheries. The project sampled fish across fishing periods, locations, gear types, and seasons so researchers could estimate which regional chum reporting groups contributed to harvest.

The work is important because South Peninsula chum harvest is mixed-stock. A fish caught in Area M may not necessarily be from the local South Peninsula. Genetic stock identification allows ADF&G to estimate contributions from regional reporting groups rather than relying only on timing, size, location, or assumptions about where fish are headed.

The report should be used carefully and read together with its uncertainty estimates, sampling design, fishery timing, and reporting-group limits. It is valuable because it gives a more current picture than older statewide or regionwide genetics studies, but it remains specific to the years sampled.

Why it matters locally

This is still a major Science Watch source, but it should not dominate the whole section. It belongs alongside sockeye, pink, Chinook, halibut, groundfish, and ocean-condition research. Its main value is showing that modern Area M management discussions can rely on genetics rather than broad claims about where every chum caught in the South Peninsula originated.

What this study cannot prove

It cannot identify the natal river of every individual fish. Reporting groups can contain multiple populations, and stock composition can change from one year, area, gear type, or fishing period to another.

Read the Study →Last checked: June 26, 2026
No. 6Area M Management Science

WASSIP sockeye research: the foundational western Alaska genetics project

Stock Composition of Sockeye Salmon Harvests in Fisheries of the Western Alaska Salmon Stock Identification Program, 2006–2008

Research typeADF&G technical report with scientific and editorial review
SpeciesSockeye salmon
Study areaChignik Bay through Kotzebue Sound, including Shumagin, South Peninsula, Chignik, Bristol Bay, and Western Alaska fisheries
Publication year2012

The Western Alaska Salmon Stock Identification Program, commonly called WASSIP, was one of the largest salmon genetics projects ever conducted in Alaska. It was created through cooperation among ADF&G, the Aleut Corporation, Aleutians East Borough, Concerned Area M Fishermen, Western Alaska organizations, and other stakeholders.

The sockeye report used genetic samples collected from fisheries between 2006 and 2008 to estimate stock composition in harvests across an enormous part of coastal Alaska. The project included Chignik, the Shumagin Islands Section, South Alaska Peninsula areas, Bristol Bay, the Kuskokwim region, and more. It was designed to show how fisheries intercept mixed stocks and to provide the information needed to estimate stock-specific harvest numbers and harvest rates.

WASSIP remains important because it shows the scale and complexity of mixed-stock salmon science. It demonstrates that stock composition must be examined by time, place, fishery, and species rather than through one statewide average.

Why it matters locally

WASSIP is historical, but it is foundational. It includes fisheries directly relevant to Area M and is still one of the best sources for explaining how genetic stock identification works and why a harvest number alone does not explain stock-specific impact.

What this study cannot prove

The sampled years were 2006–2008. Stock composition can change over time, so WASSIP results should not be used as a live estimate of current harvest composition without updated sampling.

Read the Study →Last checked: June 26, 2026
Status: Curated research library — updated as new studies are publishedSource: Peer-reviewed journals and ADF&G technical / fishery data series reportsLast checked: June 26, 2026
Source: Peer-reviewed journals, ADF&G technical and fishery data series reports, operational plans, and monitoring programsLast checked: June 26, 2026